supply chain spend analytics dashboard overview
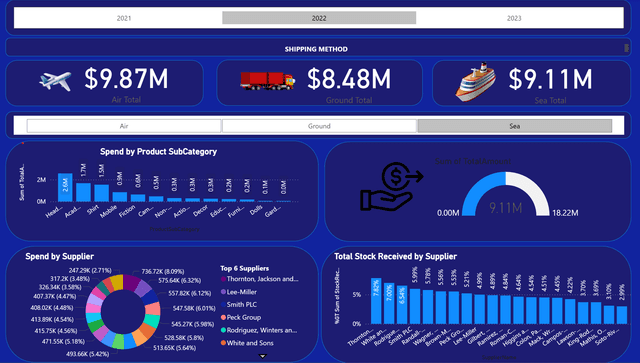
📊 Supply Chain / Spend Analytics Dashboard Overview
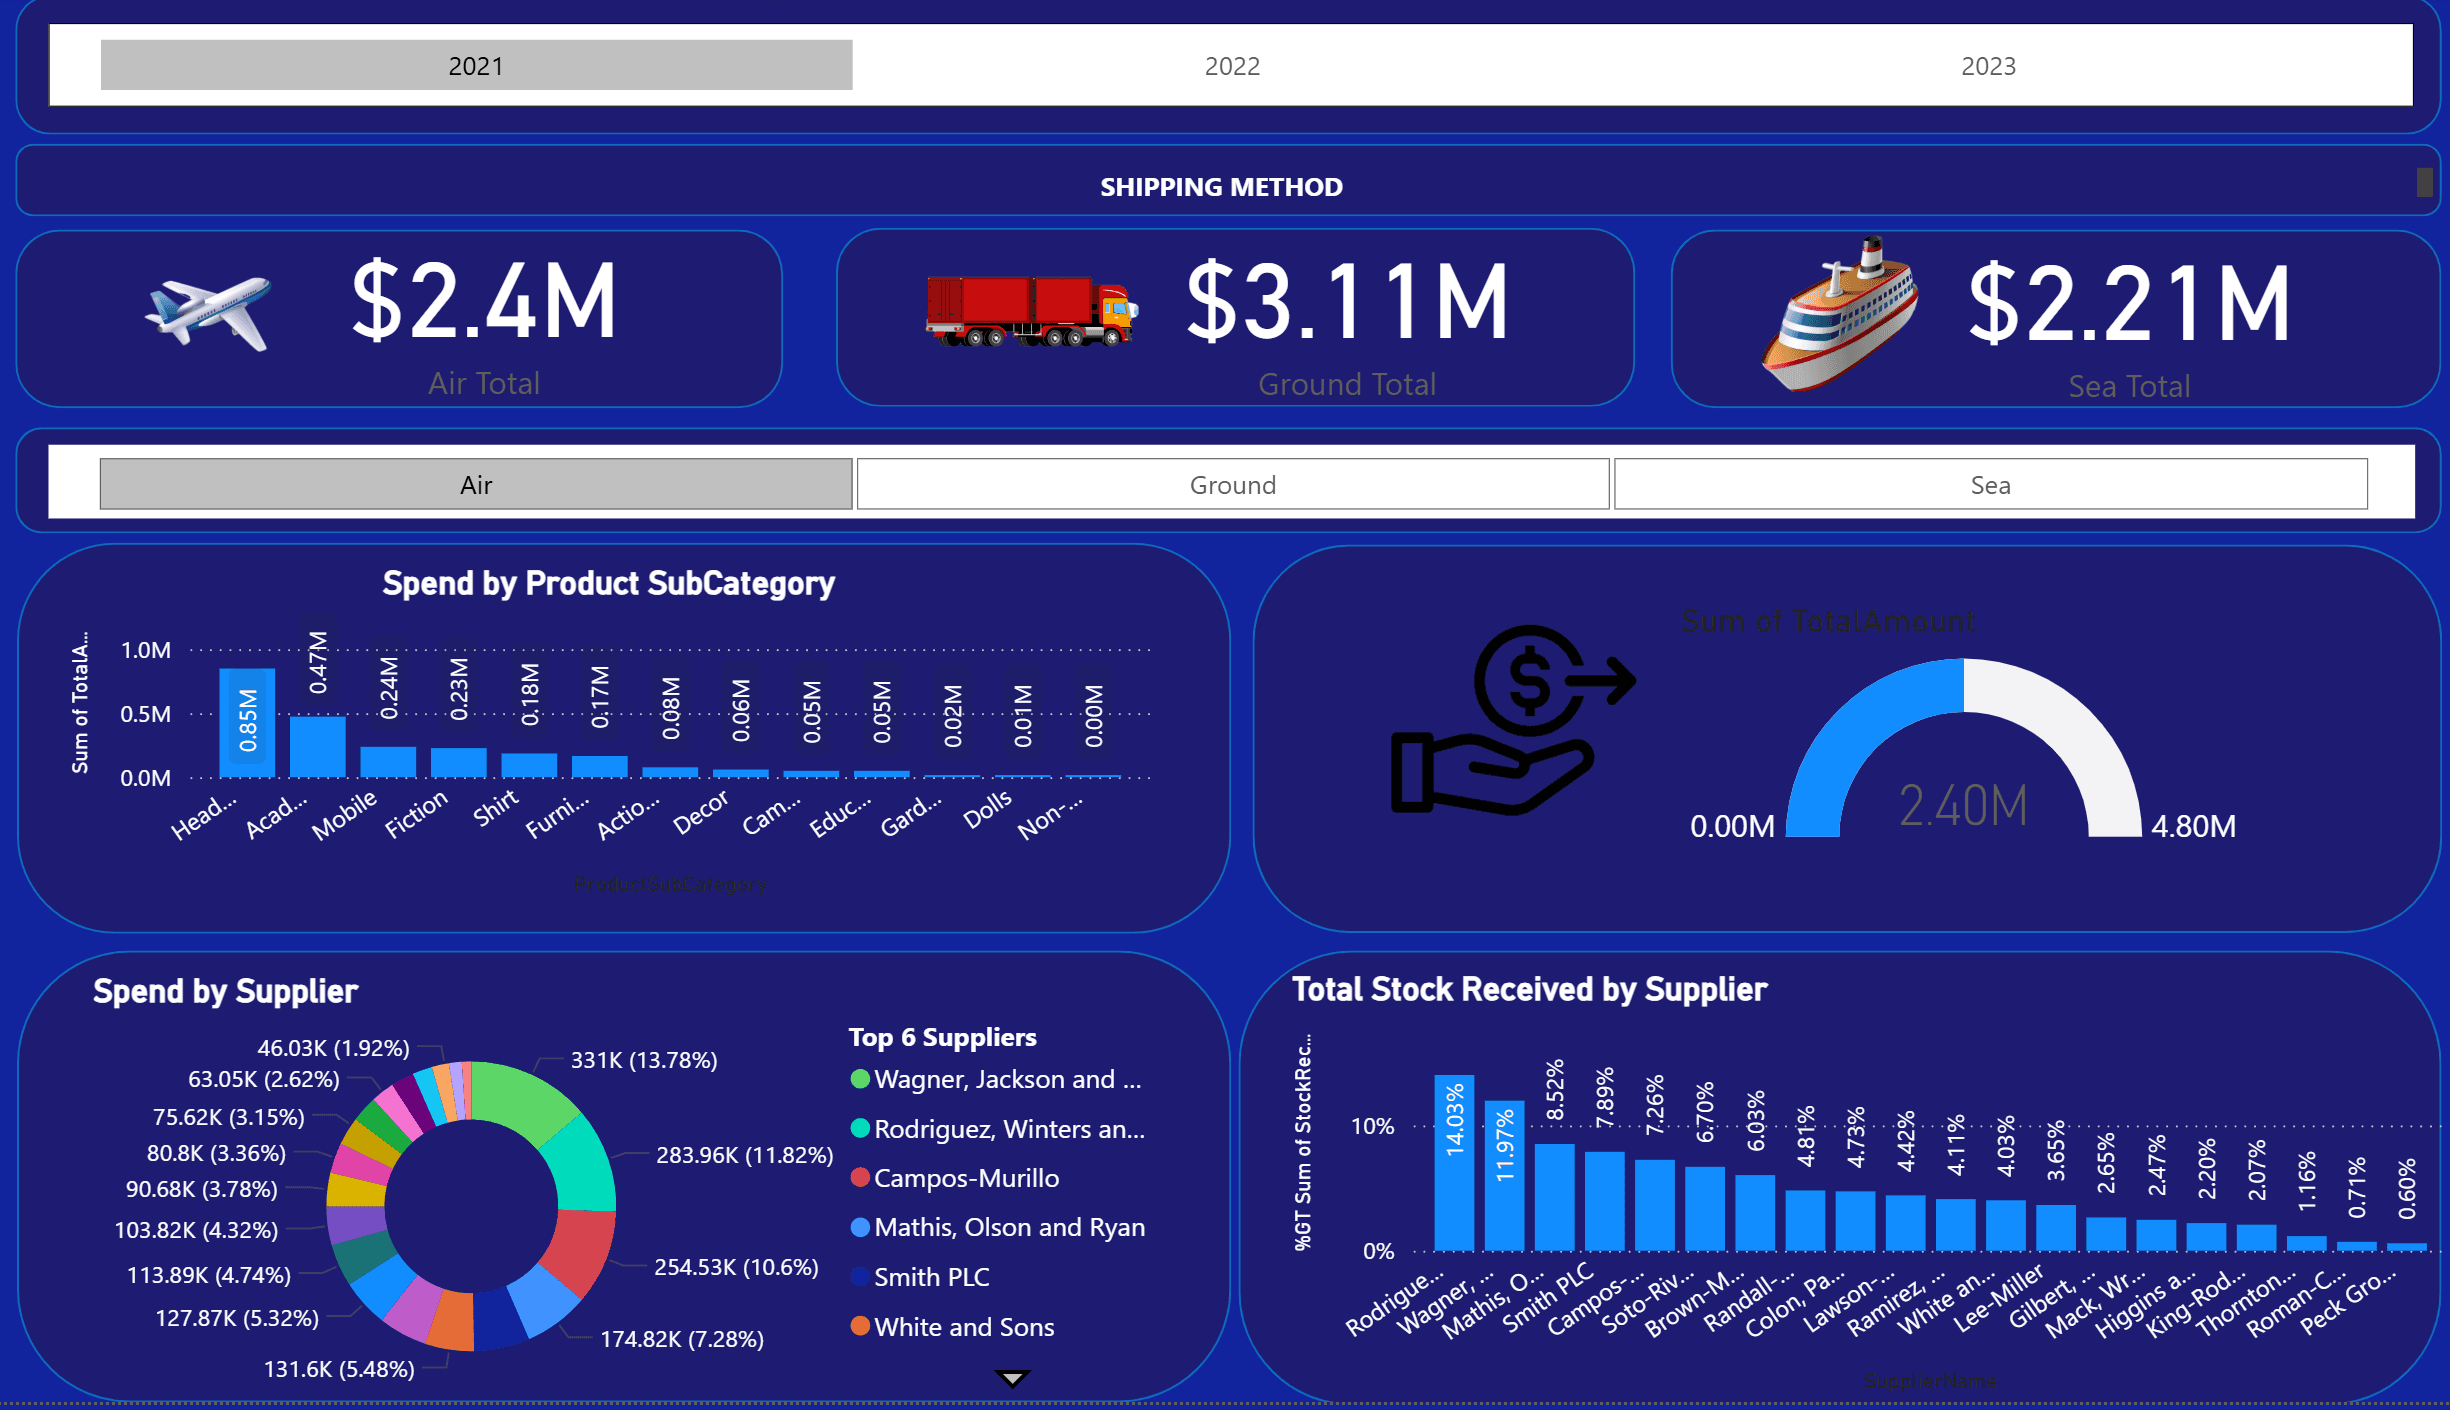
Focus Areas: Shipping Methods 🚚 | Product Categories 📦 | Supplier Performance 🧾
Period Covered: 2021–2023
✈️ 1. Shipping Method Spend
- Air: $9.87M (highest spend)
- Ground: $8.48M
- Sea: $9.11M
📌 Insight:
Air shipping leads in spend but only slightly edges out sea and ground. Assess trade-offs: speed vs. cost. Air may offer speed, but is the premium worth it?
📦 2. Spend by Product Subcategory
- Top Subcategory: “QM” – $2.1M 💰 (likely high-priority)
- Others: Range from $0.1M–$1.5M
📌 Insight:
“QM” commands the largest share. Prioritize procurement optimization, supplier terms, and accurate demand forecasting here.
🧾 3. Supplier Spend Analysis
- #1: C King-Rodriguez – $934.64K (9.47% of total) 🥇
- Others: (e.g., Smith PLC, White and Sons): $400K–$600K (≈4–6% each)
- Long Tail: Dozens of smaller suppliers contributing <5% individually
📌 Insight:
Consider supplier consolidation. Strengthening ties with high-spend partners may yield cost savings and improve operational synergy.
📦🔄 4. Total Stock Received by Supplier
- Repetitive data labels suggest unclear correlation
- Spend vs. volume delivered needs clarity
📌 Action:
Correlate inventory volumes with spend. Spot mismatches like high spend/low volume (or vice versa) to fix overstocking or supplier inefficiencies.
📌 Key Recommendations
- 🚀 Optimize Shipping: Assess if air freight's premium brings enough value. Shift toward ground/sea where feasible.
- 🤝 Supplier Rationalization: Focus on key suppliers like C King-Rodriguez for volume leverage, better pricing, and streamlined onboarding.
- 🎯 Product Subcategory Focus: Double down on “QM” — deploy forecasting tools and dynamic reorder strategies to stay ahead.
- 📉 Clarify Data Gaps: Refine metrics around stock received to ensure inventory aligns with actual spend and consumption.