Uber Ride Analytics Dashboard Overview
Uber Ride Analytics Dashboard Overview
Uber Ride Analytics Dashboard Overview thumbnail 1
Uber Ride Analytics Dashboard Overview thumbnail 2
Uber Ride Analytics Dashboard Overview thumbnail 3
Uber Ride Analytics Dashboard Overview thumbnail 4

πŸš– Uber Ride Analytics Dashboard Overview

Focus Areas: Booking Value πŸ’° | Vehicle Type πŸš— | Payment Method πŸ’³ | Location Demand πŸ“
Period Covered: Multi-month transactional dataset


πŸ’° 1. Booking Value & Performance Metrics

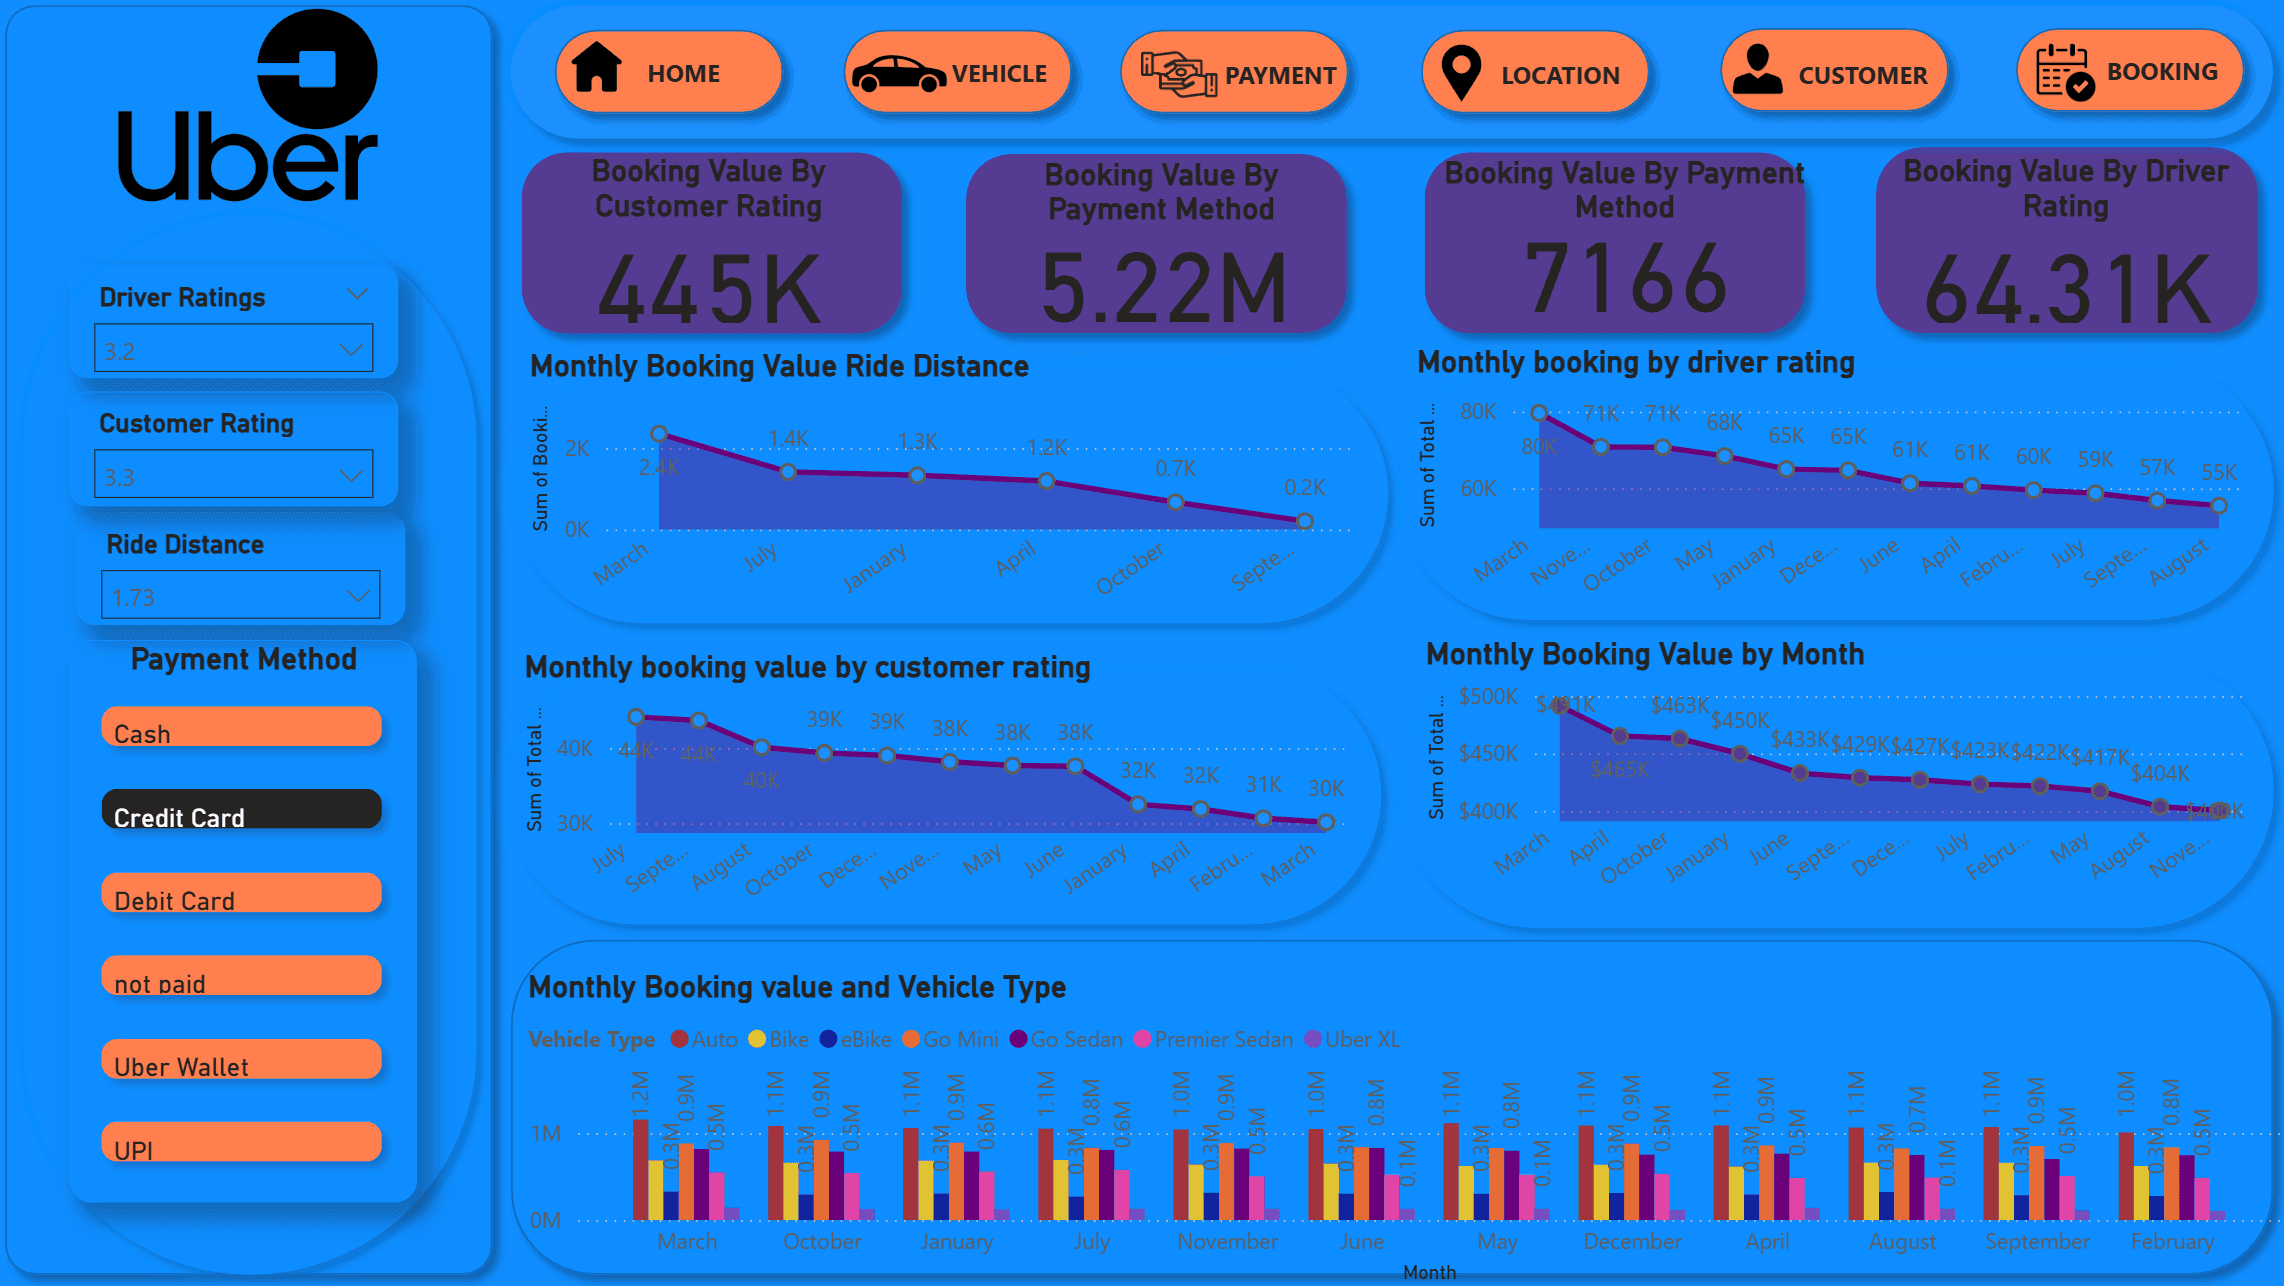
  • By Customer Rating: $445K
  • By Payment Method: $5.22M (7,166 bookings)
  • By Driver Rating: $64.31K

πŸ“Œ Insight:
Payment method preferences significantly drive revenue (5.22M), while customer/driver ratings have limited direct correlation with booking value.

πŸ“ 2. Location-Based Booking Metrics

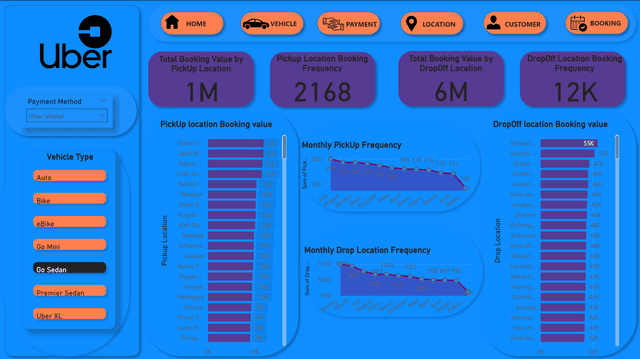
  • Top Zone: Vile Parle dominates both pickup and dropoff booking values (~55K)
  • Frequency: Pickup β‰ˆ 2,168 vs Dropoff β‰ˆ 12,000+

πŸ“Œ Insight:
Drop-off locations are revenue hotspots β€” especially business and commercial hubs. Fleet allocation and surge pricing should be prioritized here.

πŸš— 3. Vehicle Booking Frequency

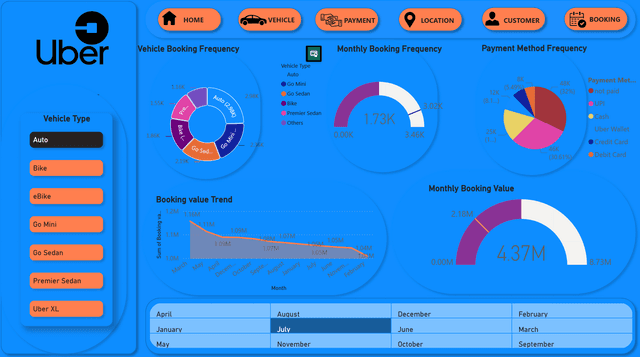
  • Most Popular: Auto (2.98K bookings) followed by Go Mini & Bike
  • Premium Categories: Uber XL & Lux show very low adoption
  • Monthly Trend: ~3.02K rides, stable but no growth

πŸ“Œ Insight:
Market is highly price-sensitive β€” low-cost vehicle categories dominate. Premium rides require targeted promotions to boost adoption.

πŸ’³ 4. Payment Insights

  • Cash: 32%
  • Credit Card: 30.6%
  • Digital Wallets (UPI, Uber Wallet): Smaller share but growing

πŸ“Œ Insight:
Cash and cards remain dominant, but digital payments are a growth opportunity. Incentivizing wallet/UPI usage can reduce operational costs.

πŸ“ˆ 5. Booking Value Trends

  • Ride Distance vs Value: Declining trend β†’ shorter trips or lower spend per km
  • Customer & Driver Rating vs Value: Consistent but falling β€” limited impact on revenue

πŸ“Œ Insight:
Overall decline suggests either seasonality or competitive pressure. Monitoring churn and promotions could help stabilize growth.


πŸ“Œ Key Recommendations

  • πŸš€ Address Decline: Investigate seasonality vs competitor influence behind falling booking values.
  • πŸ“± Push Digital Payments: Offer cashback/discounts to accelerate UPI & wallet adoption.
  • πŸ“ Optimize Locations: Focus on top 10 drop-off hubs with driver incentives & surge pricing.
  • 🎯 Grow Premium Rides: Upsell from Auto/Bike users to Go Sedan/Uber XL via loyalty offers.
  • ⭐ Improve Experience: Link customer & driver ratings to rewards to enhance service quality.

Code Snippet

Vehicle breakdown type = SUMMARIZE(ncr_ride_bookings,ncr_ride_bookings[Vehicle Type],ncr_ride_bookings[Date].[Month],
"vehicle type booking frequency",countrows(ncr_ride_bookings),
"vehicle type booking value",sum(ncr_ride_bookings[Booking Value]),
"Distance Covered",SUM(ncr_ride_bookings[Ride Distance]))


premier sedan = CALCULATETABLE (
    SUMMARIZE(ncr_ride_bookings,ncr_ride_bookings[Vehicle Type],ncr_ride_bookings[Pickup Location],ncr_ride_bookings[Date].[Month],
"premier sedan booking frequency",countrows(ncr_ride_bookings),
"premier sedan booking value",sum(ncr_ride_bookings[Booking Value]),
"premier sedan Distance Covered",SUM(ncr_ride_bookings[Ride Distance])),
ncr_ride_bookings[Vehicle Type]="premier sedan",
ncr_ride_bookings[Cancelled Rides by Customer]=0
)


frequency payment method = CALCULATETABLE (
    SUMMARIZE (
        ncr_ride_bookings,
        ncr_ride_bookings[Date].[Month],
        ncr_ride_bookings[Payment Method],
        "Payment Method Count", COUNTROWS ( ncr_ride_bookings ),
        "Total Booking Value",FORMAT( SUM ( ncr_ride_bookings[Booking Value] ), "$#,##0")
    ))

Technologies Used

Other Projects

Telco Churn
Telco Churn
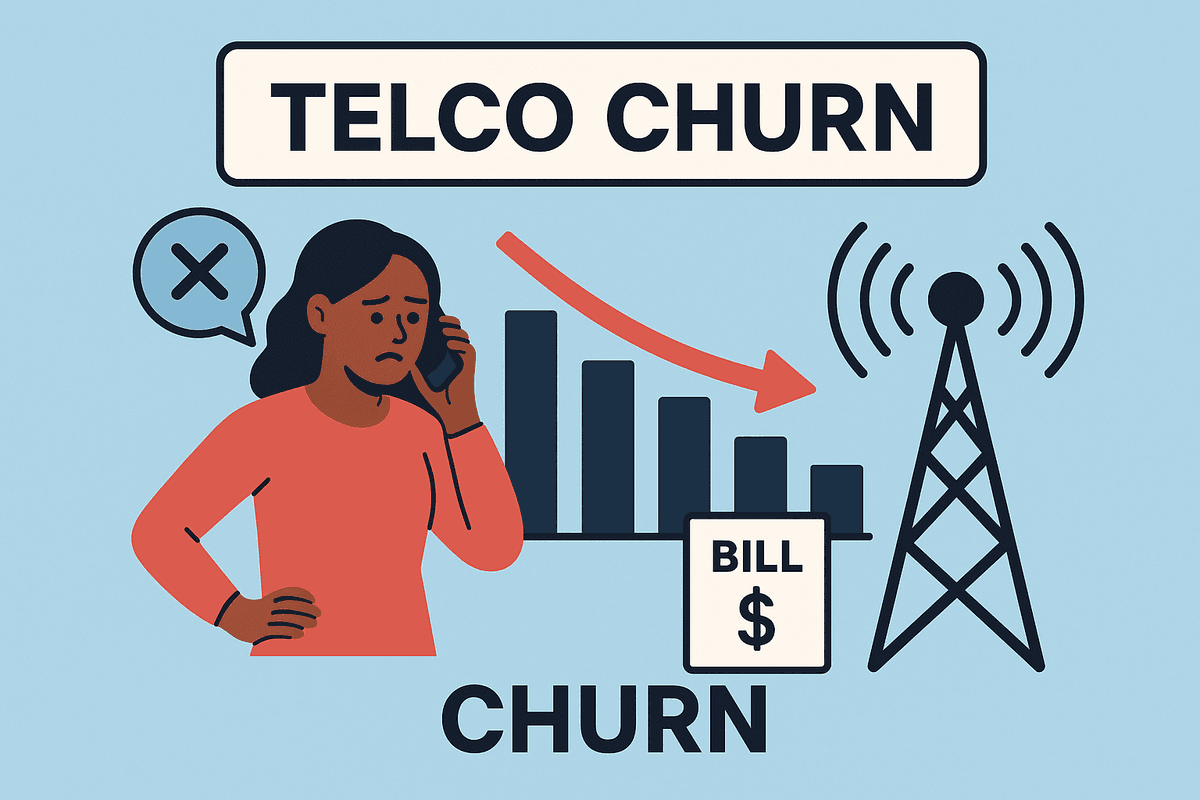
Telco churn refers to the rate at which customers discontinue their services with a telecommunications company-whether it's mobile, internet, cable TV, or bundled services. It's a critical KPI in the telecom industry because high churn rates = revenue leakage + brand instability.
Data-Science
Python
Scikit-learn
Pandas
Numpy
Tensorflow
Keras
Pytorch
View Project
supply chain spend analytics dashboard overview
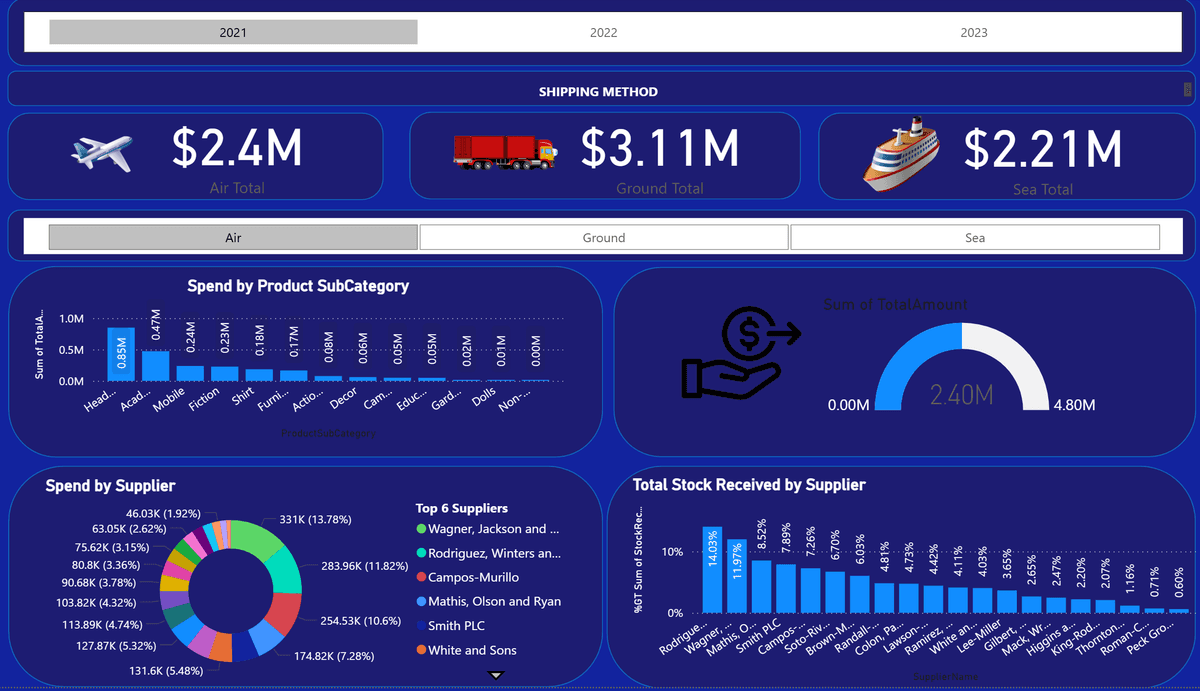
This project involved building an interactive Spend Analytics Dashboard to help logistics, procurement and finance teams gain real-time visibility into organizational spending. The dashboard consolidated multi-year spend data across vendors, product categories, and logistics channels - providing a centralized decision-support system for cost control and strategic sourcing.
Visualization
PowerBI
View Project
Scraping Airbnb
Scraping Airbnb
This project demonstrates my ability to combine web scraping techniques with machine learning to classify images. The goal was to build a pipeline that scrapes images of shoes from a website and uses them for training a machine learning model.
WebScraping
BeautifulSoup
Selenium
Scrapy
View Project
Customers Transaction Analysis
A comprehensive database management system for a small business.
Database
SQL
MySQL
PostgreSQL
MongoDB
Pyspark
View Project
Bulldozer Sale Price Prediction
This project tackled a real-world business problem sourced from a Kaggle competition hosted by Caterpillar Inc. Using structured data containing product specifications, usage history, and transactional attributes, I built a machine learning pipeline capable of forecasting future equipment prices a key tool for optimizing resale strategy in capital-intensive industries.
Data-Science
Python
Scikit-learn
Pandas
Numpy
Tensorflow
Keras
Pytorch
View Project
Credit Score Prediction
This project focuses on building a predictive model to estimate an individual's credit score category-poor, Standard, or Good-based on financial and behavioral attributes. The goal is to assist financial institutions in automating credit risk assessment, improving loan approval decisions, and reducing default rates.
Data-Science
Python
Scikit-learn
Pandas
Numpy
Tensorflow
Keras
Pytorch
View Project
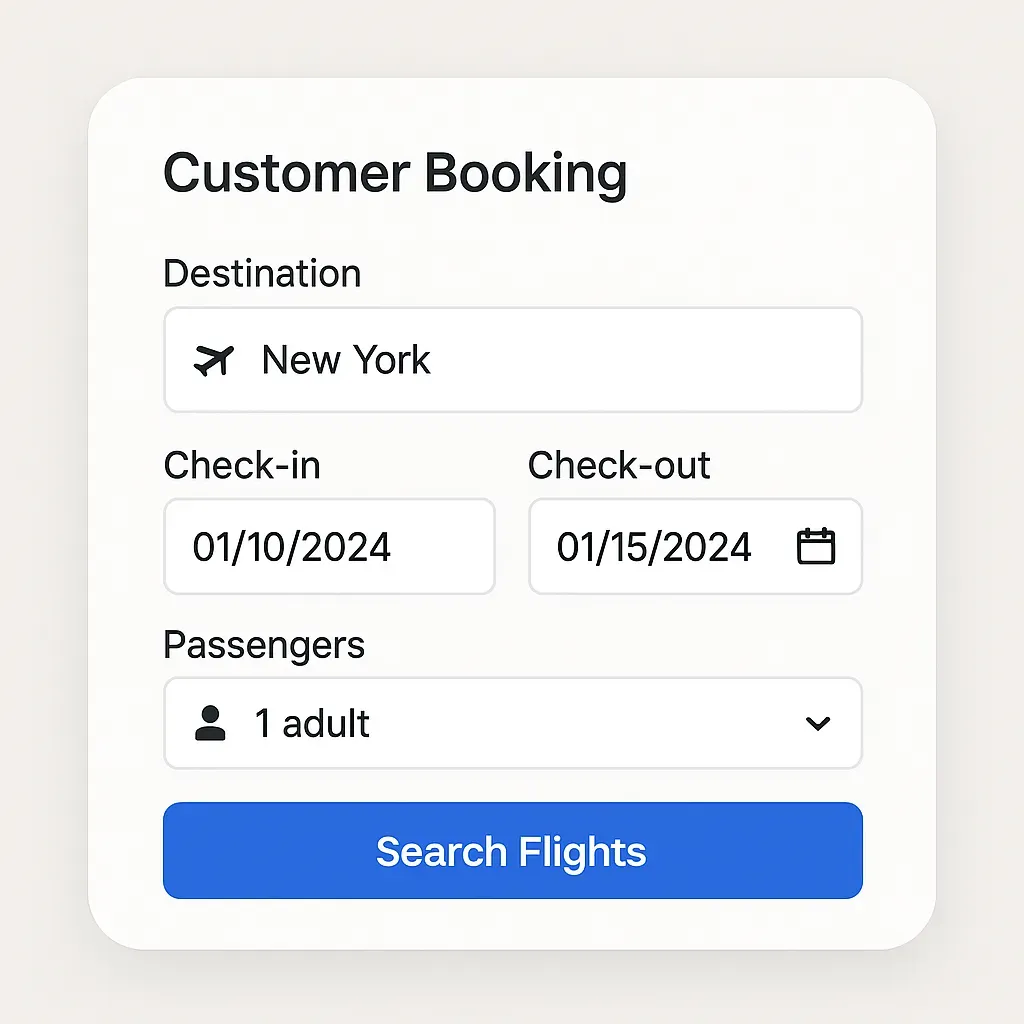
Customer Booking Prediction
This Customer Booking Prediction project uses historical transaction data, customer behavior patterns, and contextual variables to forecast the likelihood and timing of future bookings. By applying machine learning models such as Logistic Regression, XGBoost, or Neural Networks, organizations can identify which customers are most likely to make a booking, when they are likely to do so, and what factors influence their decision
Data-Science
Python
Scikit-learn
Pandas
Numpy
Tensorflow
Keras
Pytorch
View Project
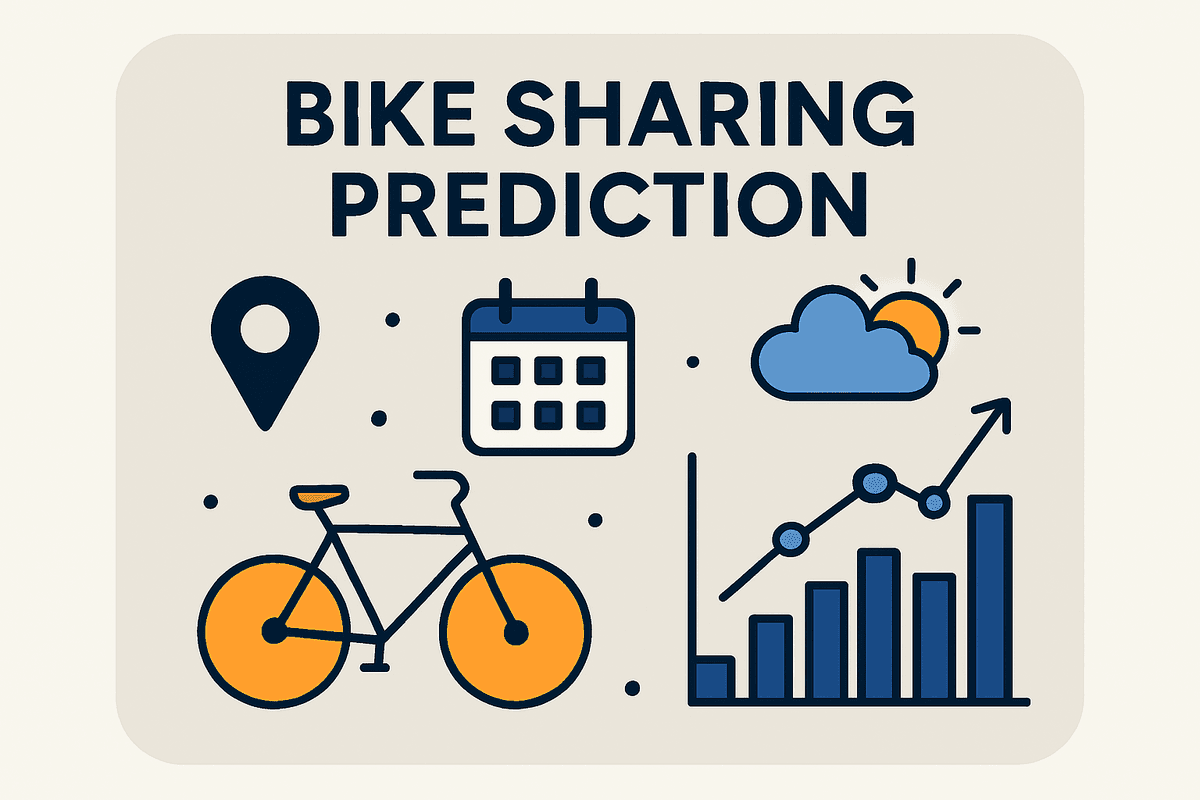
Bike Sharing Prediction
This project Bike Sharing Prediction leverages historical rental data, weather patterns, seasonal trends, and time-based variables to forecast future demand for shared bicycles. This predictive modeling process typically involves data preprocessing, feature engineering, and the application of machine learning algorithms such as Random Forest and Gradient Boosting
Data-Science
Python
Scikit-learn
Pandas
Numpy
Tensorflow
Keras
Pytorch
View Project
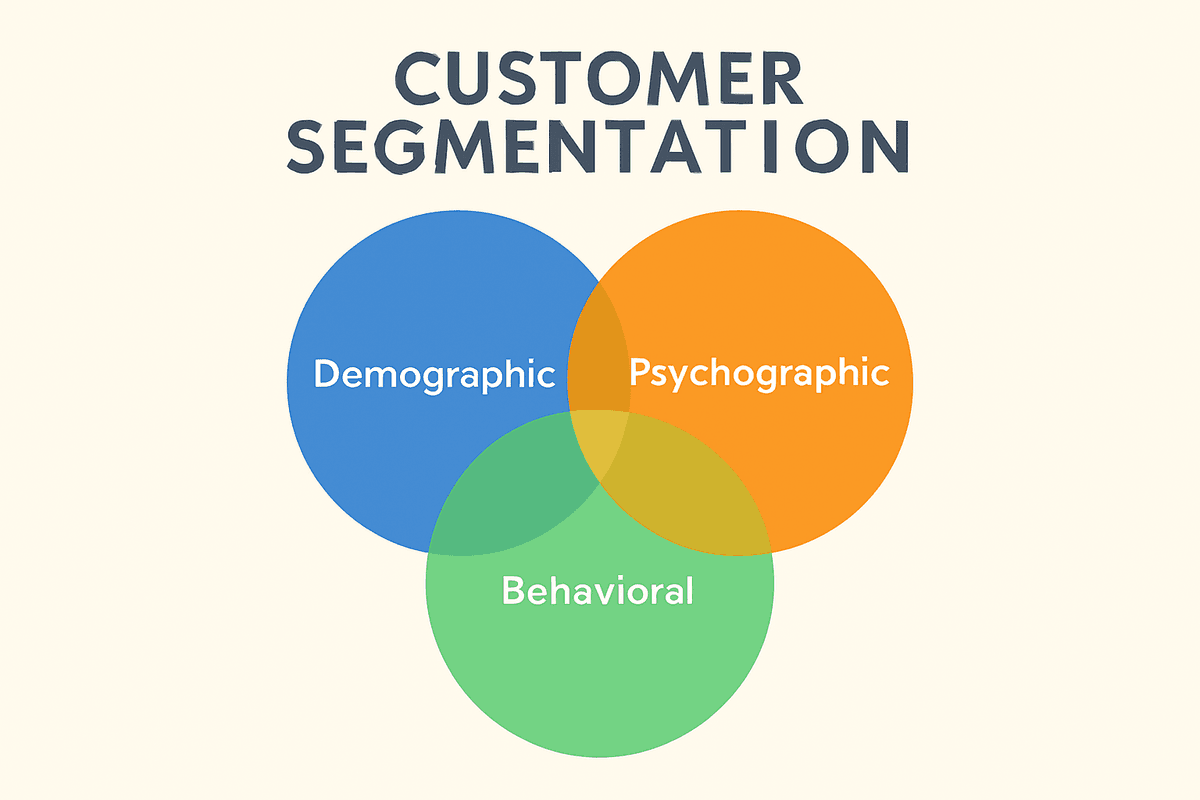
Customer Segmentation
Developed a predictive classification model to determine the likelihood of a customer completing a booking. The project enables businesses to reduce cart abandonment, optimize marketing strategies, and increase conversion rates.
Data-Science
Python
Scikit-learn
Pandas
Numpy
Tensorflow
Keras
Pytorch
View Project
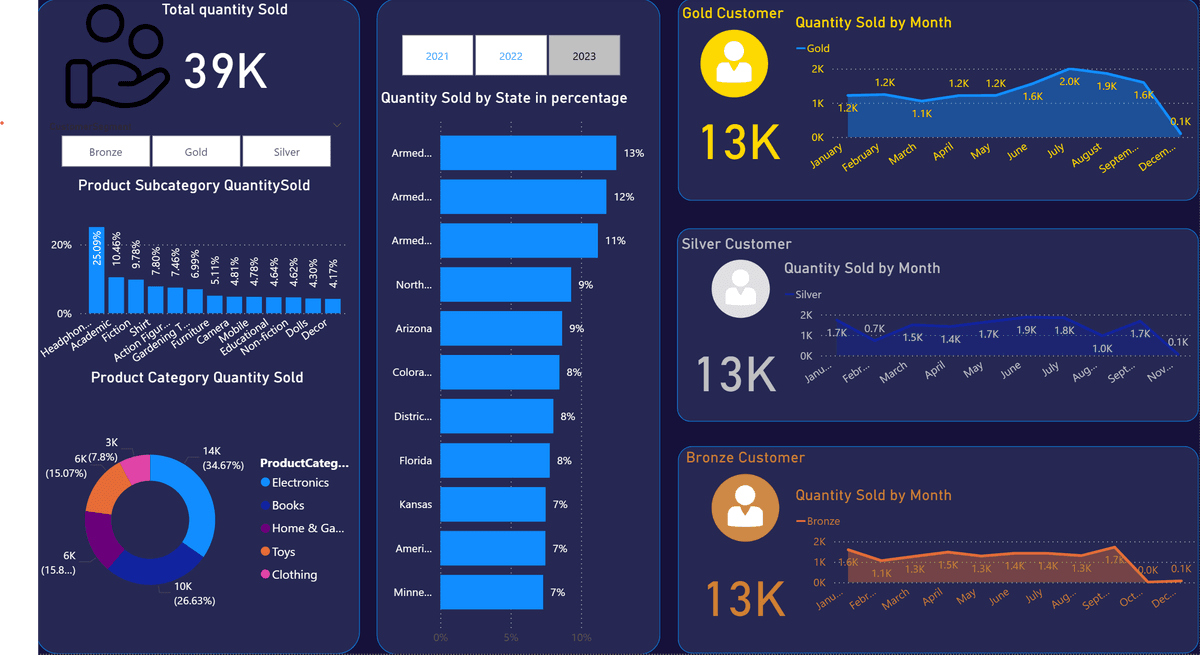
Sales Dashboard using Power BI
This Sales Performance Dashboard provides actionable insights into product sales, customer segmentation, and regional performance. Built with Power BI, this dashboard supports strategic decision-making by consolidating large volumes of transactional data into an interactive and visually intuitive interface.
Visualization
PowerBI
View Project
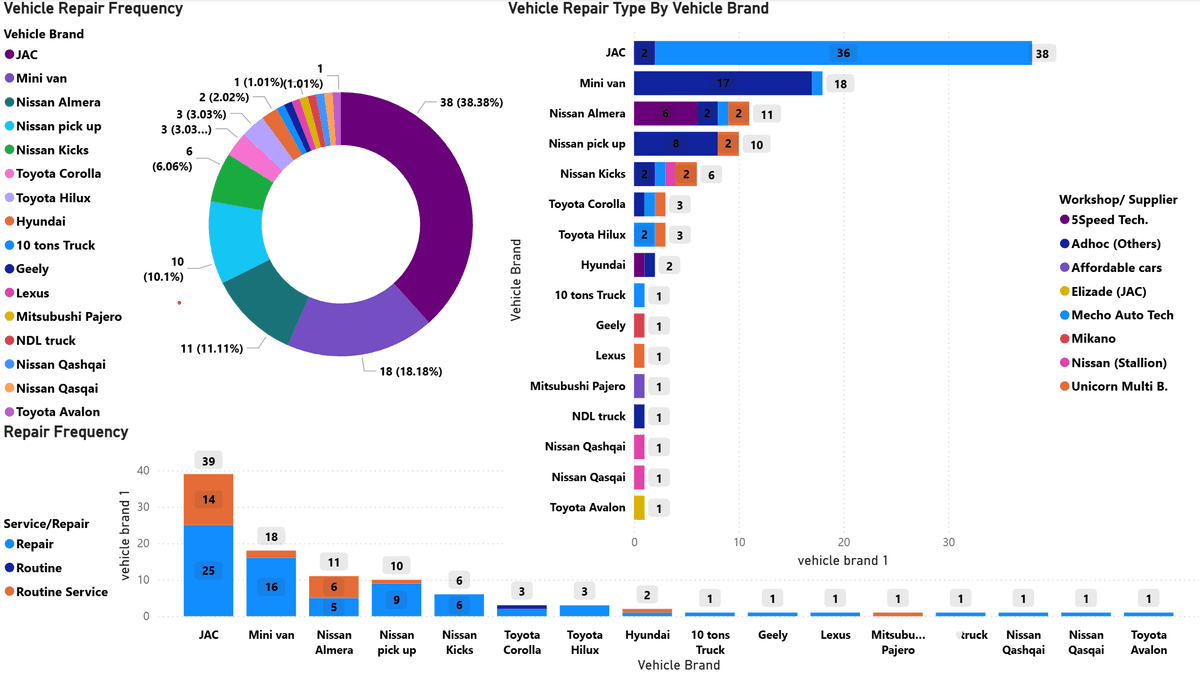
Vehicle Repair Dashboard
This Vehicle Repair Dashboard provides a strategic lens into fleet maintenance activities across suppliers, vehicle brands, and service types. It enables data-driven decision-making by highlighting repair patterns, supplier performance, and maintenance trends.
Visualization
PowerBI
View Project
Web Scraping and Image Classification with TensorFlow
This project demonstrates my ability to combine web scraping techniques with machine learning to classify images. The goal was to build a pipeline that scrapes images of shoes from a website and uses them for training a machine learning model.
WebScraping
BeautifulSoup
Selenium
Scrapy
View Project
British Airways Customer Review Web Scraping, Text Classification, Sentiment Analysis, and Customer Satisfaction
This project demonstrates my ability to combine web scraping techniques with machine learning to classify images. The goal was to build a pipeline that scrapes images of shoes from a website and uses them for training a machine learning model.
WebScraping
BeautifulSoup
Selenium
Scrapy
View Project
British Airway Webscraping with Beautifulsoup
This project demonstrates how web scraping can be used to extract valuable data from airline websites, specifically British Airways, using Python's BeautifulSoup library. The goal was to scrape flight-related data, such as flight details, prices, and other useful information, from the British Airways website for analysis.
WebScraping
BeautifulSoup
Selenium
Scrapy
View Project
Ecommerce Website Webscraping
This project uses requests and BeautifulSoup to scrape product listings from StockX’s e-commerce platform. The scraper extracts product name, description, price, and image link across multiple paginated results, storing them in a structured dataset for analysis or integration into business workflows.
WebScraping
BeautifulSoup
Selenium
Scrapy
View Project
Jumia Website Scraping
This project uses requests and BeautifulSoup to scrape product listings and prices from Jumia Nigeria. The scraper works across multiple pages and categories, returning structured datasets ready for analysis.
WebScraping
BeautifulSoup
Selenium
Scrapy
View Project
Stack Overflow Text Classification
This project involves building a multi-class classification model to predict the tag of a Stack Overflow question based on its content. The goal is to classify programming questions into specific tags such as Python, CSharp, JavaScript, and Java using Natural Language Processing (NLP) techniques.
Data-Science
Deep-Learning
Python
Numpy
Tensorflow
Keras
Pytorch
View Project
Fruits Image Classification
This project leverages image classification techniques to classify fruit images into their respective categories using Convolutional Neural Networks (CNN). The dataset used is the Fruits 360 dataset, which includes a wide variety of fruits and vegetables, and the goal was to build a model capable of predicting the type of fruit based on the image.
Data-Science
Deep-Learning
Python
Numpy
Tensorflow
Keras
Pytorch
View Project
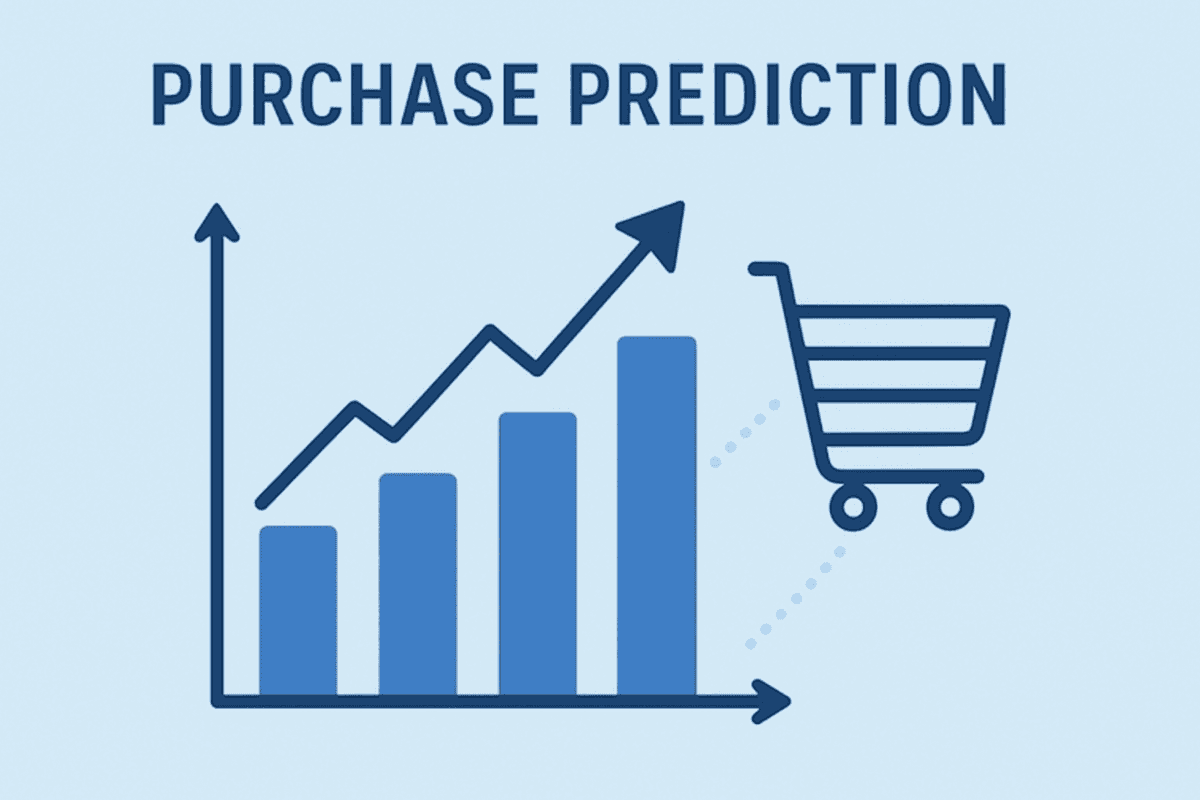
Purchase Prediction
Purchase Prediction
Purchase Prediction with Logistic Regression.This project focuses on using logistic regression to predict customer purchases based on various demographic and behavioral features. The goal was to predict whether a customer will make a purchase (binary classification) using factors such as age, gender, marital status, income, occupation, and more.
Data-Science
Scikit-learn
Python
Numpy
K-Means
PCA
Logistic Regression
View Project
Ebay Sneakers WebScraping Using Selenium
This project demonstrates the use of Python-based web scraping to extract product information from eBay. The focus was on collecting structured data such as item titles, prices, and condition from search result pages, enabling price analysis and market research.
WebScraping
BeautifulSoup
Selenium
Scrapy
View Project
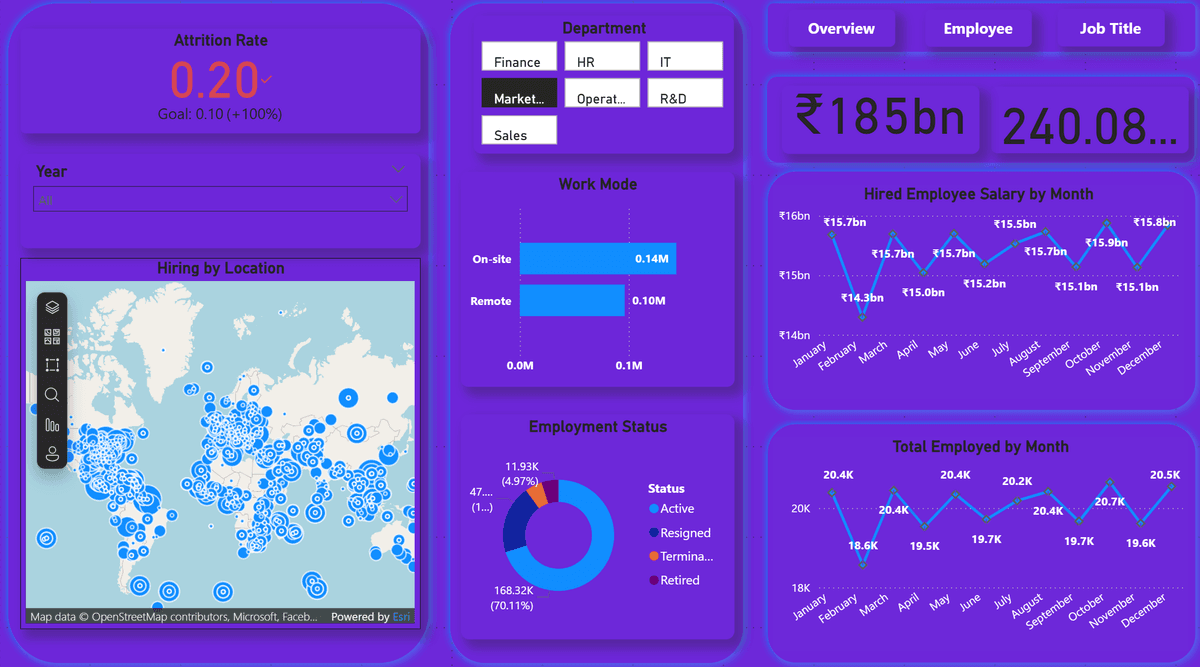
HR Analytics Dashboard Employee & Attrition Insights
This project involved building an Interactive HR analytics dashboard covering employee attrition, hiring, salaries and departmental performance. Includes data visualizations and KPIs for strategic HR decision-making.
Visualization
PowerBI
View Project