HR Analytics Dashboard Employee & Attrition Insights
HR
HR Analytics Dashboard — Employee & Attrition Insights
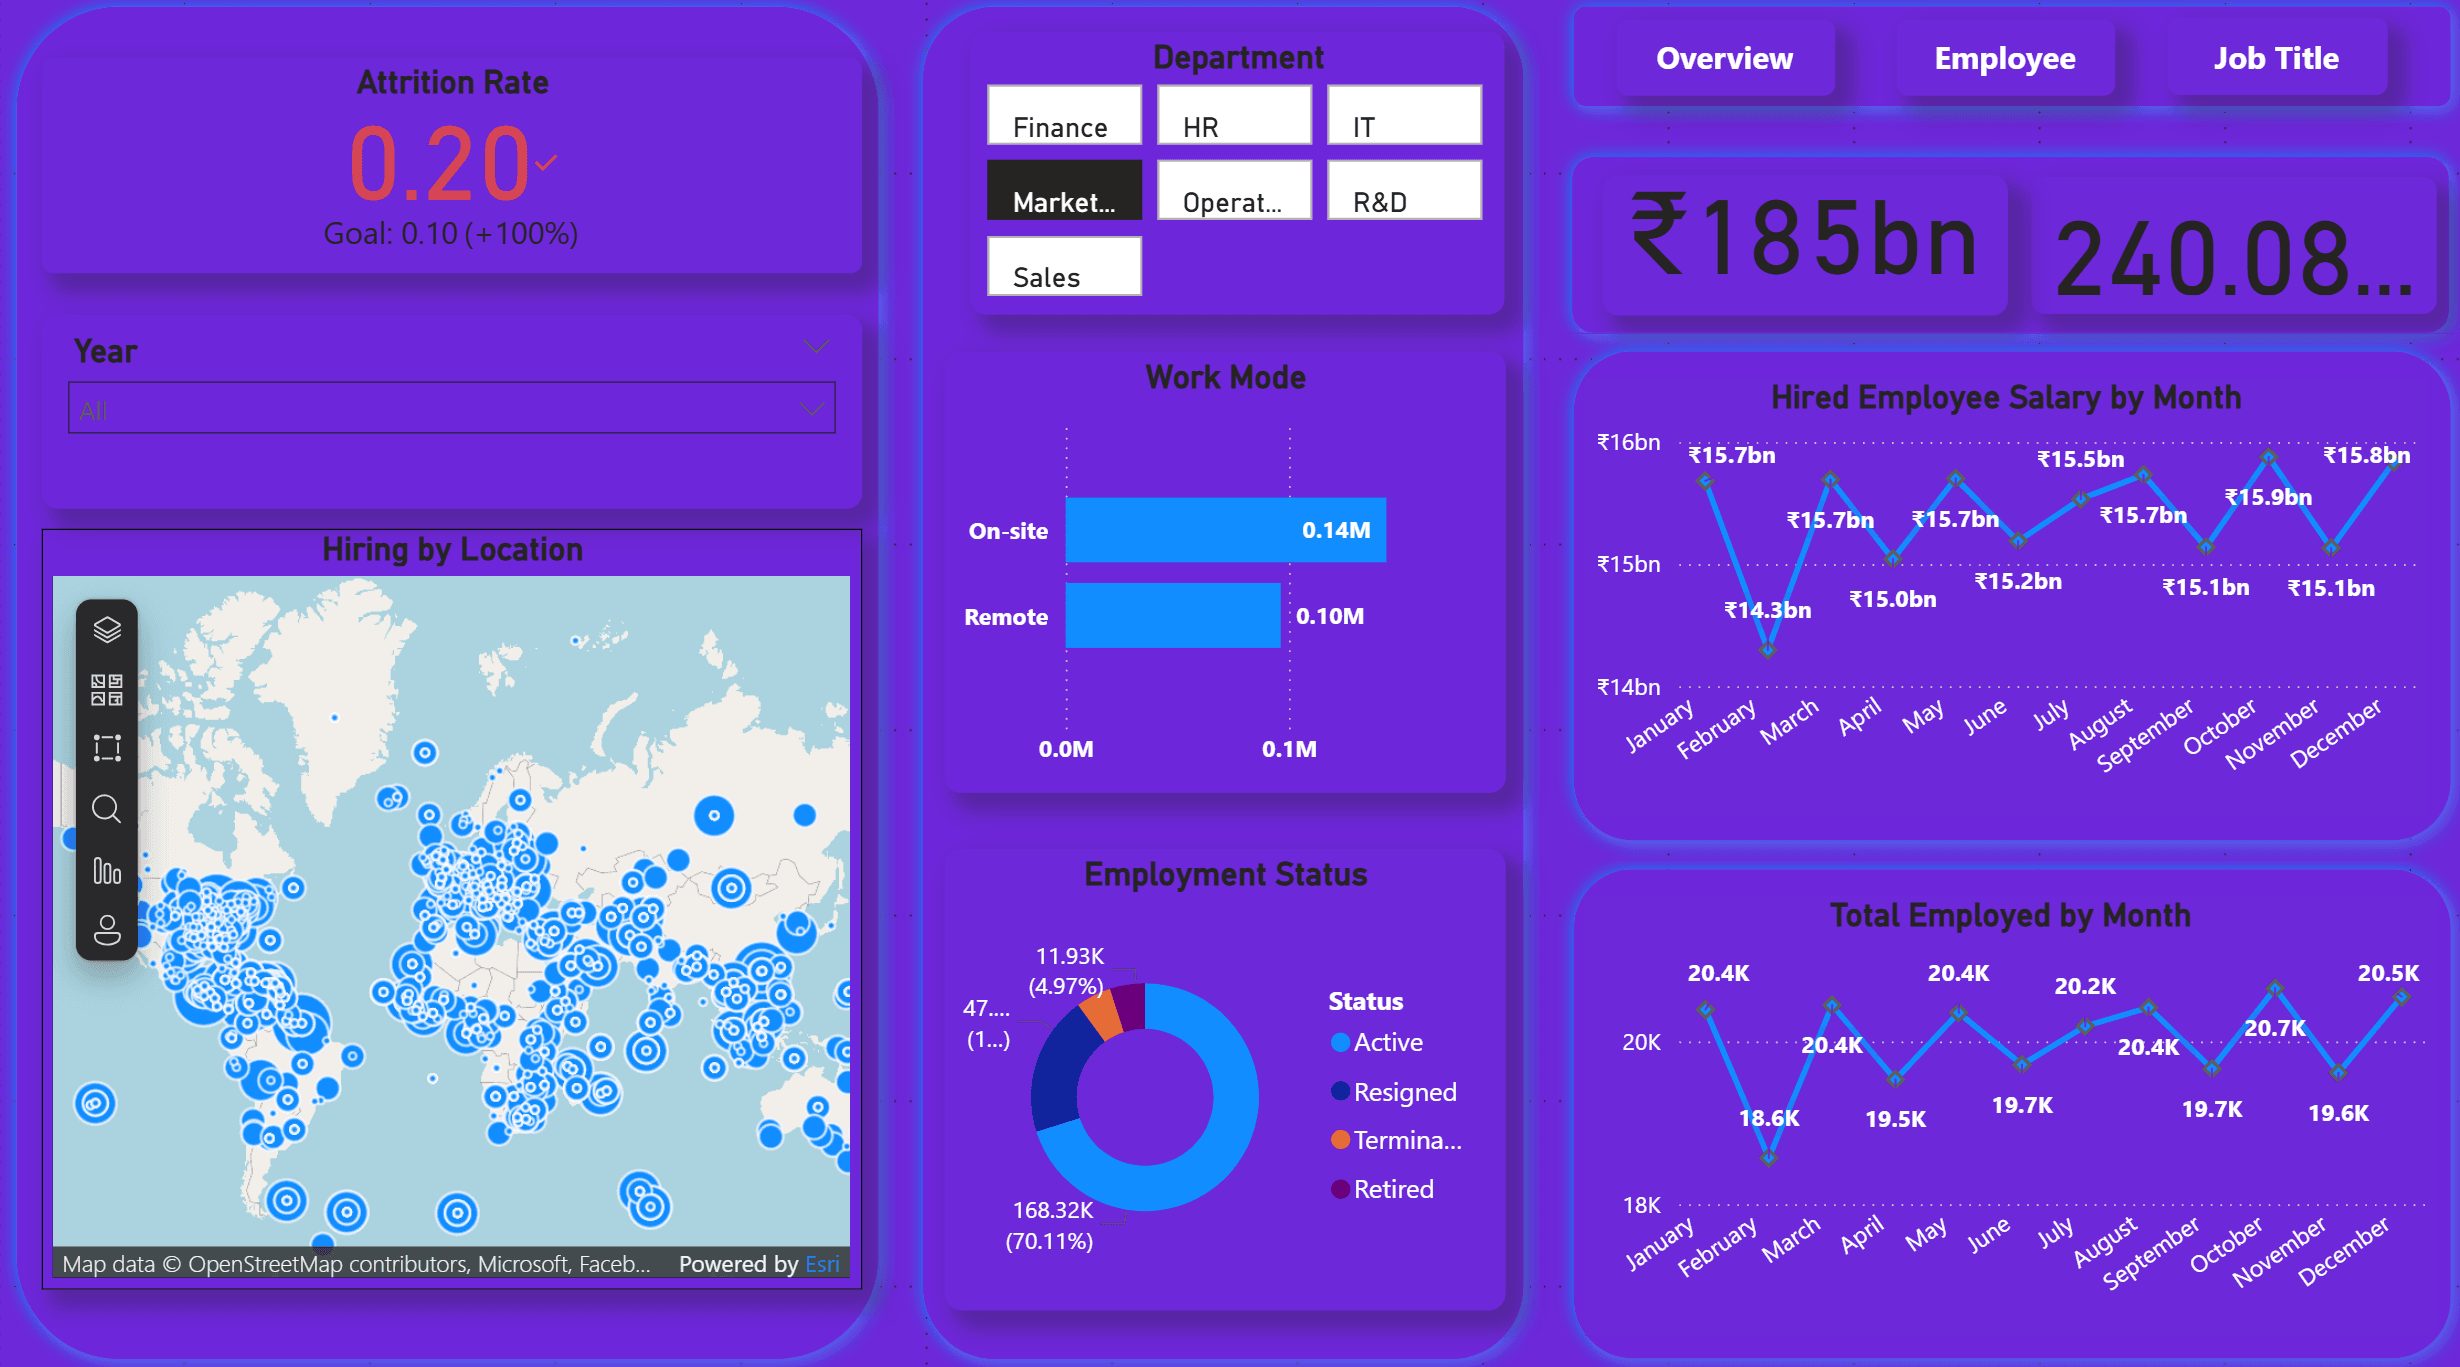
Interactive Power BI dashboard visualizing key HR metrics such as attrition, hiring trends, salaries, departmental performance and work modes for better workforce planning.
Project Overview
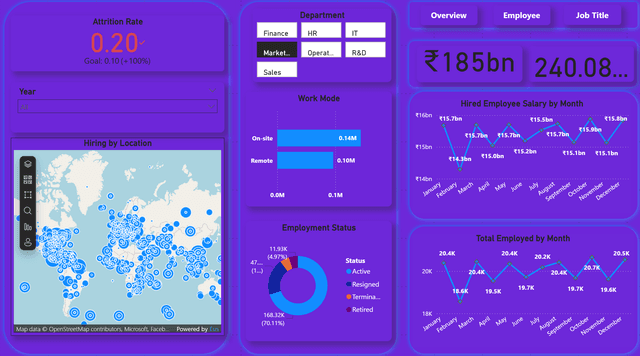
This project presents a comprehensive HR analytics dashboard built in Power BI to track and analyze employee data across multiple departments and job titles. It highlights attrition trends, hiring patterns, salary distributions and work mode preferences to support data-driven HR decisions.
Key Features
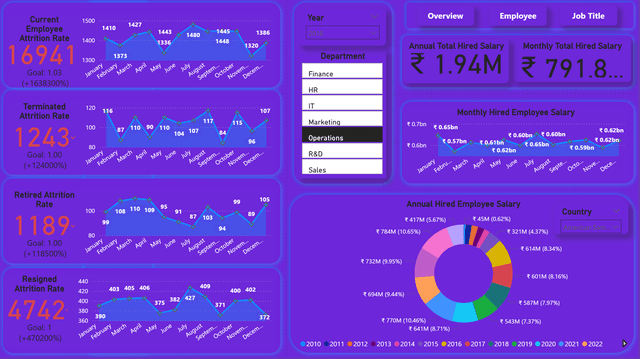
- Attrition Metrics: Current, terminated, retired and resigned attrition rates with monthly breakdowns and goal comparisons.
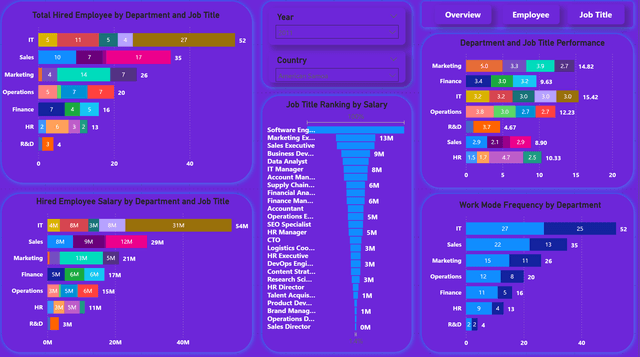
- Hiring & Salaries: Annual and monthly total hired salaries, hired employee salary by department and job title.
- Departmental Performance: Visual rankings of departments and job titles based on performance and salary spend.
- Work Mode & Geography: On-site vs remote headcounts and global hiring locations mapped.
- Employment Status: Active, resigned, terminated and retired distributions visualized in a donut chart.
Technologies Used
- Power BI — dashboard creation and interactivity
- Excel/CSV — HR data preparation
- DAX & Power Query — data modeling and calculations
- Map visualizations & KPIs — to show geographic and goal tracking insights
How to run / explore
- Connect your HR dataset to Power BI Desktop.
- Apply Power Query transformations (cleaning, renaming, formatting dates).
- Load data model and DAX measures for attrition, salary, and performance KPIs.
- Publish or share dashboard to Power BI Service for interactive viewing.
Code Snippet
Dept Hiring break down = CALCULATETABLE(SUMMARIZE('HR_Data_MNC_Data Science Lovers',
    'HR_Data_MNC_Data Science Lovers'[Hire_Date],'HR_Data_MNC_Data Science Lovers'[Department],
        'HR_Data_MNC_Data Science Lovers'[Job_Title],
         'HR_Data_MNC_Data Science Lovers'[Country],
            "Total Job title",countrows('HR_Data_MNC_Data Science Lovers'),
               // "Total Employed",countrows('HR_Data_MNC_Data Science Lovers'[Employee_ID]),
                "avg performance",average('HR_Data_MNC_Data Science Lovers'[Performance_Rating]),

                    "Salary",SUM('HR_Data_MNC_Data Science Lovers'[Salary_INR]),

                        "Experience",TRUNC(AVERAGE('HR_Data_MNC_Data Science Lovers'[Experience_Years]),2),
                       "Total Employed",DISTINCTCOUNT('HR_Data_MNC_Data Science Lovers'[Employee_ID]),
                                 "Active",
            CALCULATE (
                COUNTROWS ( 'HR_Data_MNC_Data Science Lovers' ),
                'HR_Data_MNC_Data Science Lovers'[Status] = "Active"),
                 "Resigned",
            CALCULATE (
                COUNTROWS ( 'HR_Data_MNC_Data Science Lovers' ),
                'HR_Data_MNC_Data Science Lovers'[Status]="Resigned"),
            "Retired",
            CALCULATE(
                COUNTROWS ( 'HR_Data_MNC_Data Science Lovers' ),
                'HR_Data_MNC_Data Science Lovers'[Status]="Retired"),

            "Terminated",
            CALCULATE(
                COUNTROWS ( 'HR_Data_MNC_Data Science Lovers' ),
                'HR_Data_MNC_Data Science Lovers'[Status]="Terminated"),

            "Resigned Rate",((CALCULATE(
                COUNTROWS ( 'HR_Data_MNC_Data Science Lovers' ),
                'HR_Data_MNC_Data Science Lovers'[Status]="Resigned")/DISTINCTCOUNT('HR_Data_MNC_Data Science Lovers'[Employee_ID])))*100,

             "Active Rate",((CALCULATE(
                COUNTROWS ( 'HR_Data_MNC_Data Science Lovers' ),
                'HR_Data_MNC_Data Science Lovers'[Status]="Active")/DISTINCTCOUNT('HR_Data_MNC_Data Science Lovers'[Employee_ID])))*100,

            "Retired Rate",((CALCULATE(
                COUNTROWS ( 'HR_Data_MNC_Data Science Lovers' ),
                'HR_Data_MNC_Data Science Lovers'[Status]="Retired")/DISTINCTCOUNT('HR_Data_MNC_Data Science Lovers'[Employee_ID])))*100,

            "Termination Rate",((CALCULATE(
                COUNTROWS ( 'HR_Data_MNC_Data Science Lovers' ),
                'HR_Data_MNC_Data Science Lovers'[Status]="Terminated")/DISTINCTCOUNT('HR_Data_MNC_Data Science Lovers'[Employee_ID])))*100


                ))